


Peter Lynch ran the Magellan Fund at Fidelity and compounded returns at 29% per year for over a decade — one of the best records in investing history.
His core idea was simple.
Earnings drive stock prices.
Not immediately. Not cleanly. But over time, they do.
“Earnings” just means profit — what a company actually makes. And Lynch’s point was straightforward: in the short run, markets can price stocks on excitement, fear, or narrative. But over time, price and profit reconnect.
This article tests that idea using a real stock: AeroVironment (AVAV).
AeroVironment makes small defence drones used by the US and its allies — an area that has seen rising investor interest in recent years.
Over the last six months, AVAV has fallen nearly 50% — from narrative-driven highs back to where its earnings actually justify. That move isn’t random.
A Simple Way to Estimate Fair Value
There’s a simple way to anchor a stock to its earnings — used by Lynch and described in his book One Up on Wall Street — called the Earnings Line.
It works like this:
The company’s profit over the last year (called trailing twelve months earnings per share, or TTM EPS)
Multiply it by the typical valuation the market has historically given that business
That gives you a rough fair value.
We’ll call it the Earnings Line (EL):
EL = Earnings × Typical P/E multipleP/E (price-to-earnings) simply means how much investors are willing to pay for each $1 of profit.
For AVAV today:
Earnings (TTM EPS): $3.01
Typical valuation: ~63× earnings
Earnings Line: ~$189.63
In other words:
Investors have historically paid about 63 times what AVAV earns each year.
The EL is not a prediction. It’s a reference point — a way of asking:
What would this business be worth if it were priced normally?
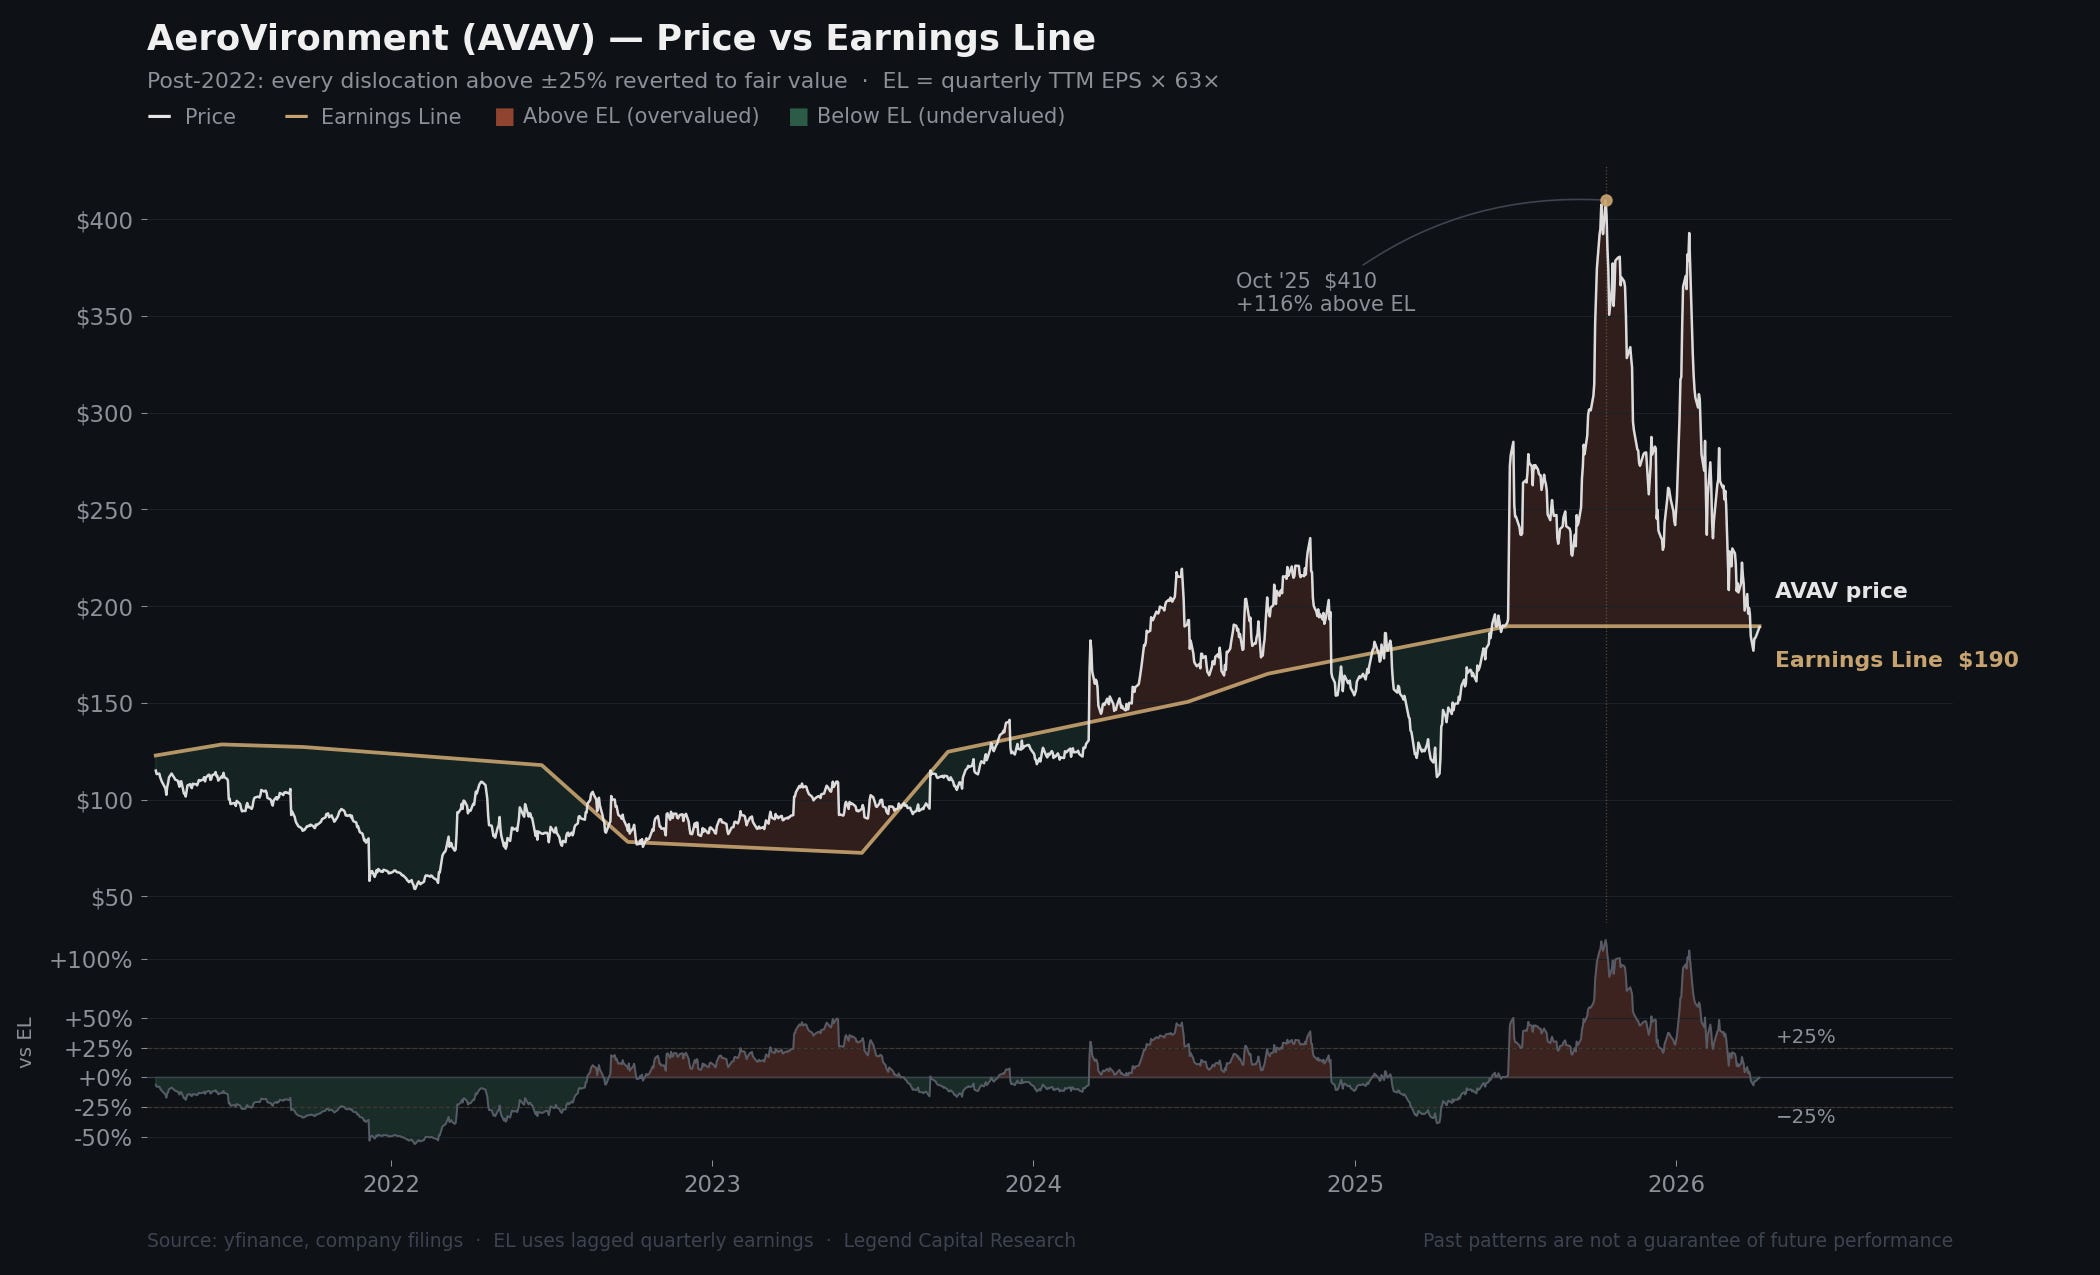
Price Reverting to Earnings Line — AeroVironment (AVAV) Price vs Earnings Line (2021-2026)
What Happened to AVAV
In late 2025, AVAV wasn’t trading anywhere near that level.
The stock ran sharply higher, driven by strong sentiment around defence technology and growth expectations.
At the peak:
Price reached over $400
Earnings Line was roughly $190
That’s a premium of more than 100%.
In simple terms:
The market was pricing AVAV as if its earnings would need to roughly double — at the same valuation — to justify the price.
That’s not a small stretch. It’s a dislocation.
What Happened Next
Over the following months:
The stock fell 47.5% over six months
It is now trading at $189.26
The Earnings Line sits at $189.63
Price didn’t fall because the business deteriorated.
In fact:
Earnings are growing (+44.0% YoY)
Revenue growth is +143.4% YoY
What changed was the relationship between price and earnings — not the business itself.
And eventually:
Price returned to where earnings said it should be.
This Isn’t a One-Off
Looking at every time AVAV moved more than ±25% away from its Earnings Line over the past decade:
19 dislocation events
84.2% reverted back to fair value
In the post-2022 regime:
→ 7 out of 7 reverted (100%)
These reversions did not happen immediately.
On average:
Reversion occurred over weeks to months
Overvalued periods corrected faster
Undervalued periods recovered more gradually
The key insight is this:
The Earnings Line doesn’t predict timing. It predicts destination.
What This Means in Practice
This is not a trading signal.
It’s a positioning tool.
When price is far above earnings (e.g. +25% or more):
Expectations are ahead of reality
Risk of medium-term decline increases
When price is far below earnings (e.g. -25% or more):
The business is being discounted
Recovery tends to happen — but more slowly
When price ≈ earnings (like today):
Price and fundamentals are aligned
Future returns depend on earnings growth, not revaluation
When This Framework Breaks
There is one important exception.
If earnings themselves change materially — for example:
A major shift in growth
A structural change in profitability
Then the “anchor” moves.
In those cases:
Price does not revert — because fair value has changed.
How to Use This
You don’t need a complex model to apply this idea.
A simple approach:
Look at what a company earns over the last year (EPS — earnings per share)
Check what valuation the market has typically applied (P/E — price-to-earnings multiple)
Compare it to today’s price
If the price is far above what earnings justify, be cautious. If it’s far below, be patient and consider adding gradually.
If you want to go deeper, Peter Lynch’s One Up on Wall Street remains one of the clearest guides to thinking about stocks this way.
Final Thought
Peter Lynch put it simply:
“The stock market is filled with individuals who know the price of everything and the value of nothing.”
AVAV is a recent example of what happens when price runs ahead of value — and then comes back.
Earnings didn’t move. Price did.
The Conviction Play.
This article reflects personal research and is for informational purposes only. It is not financial advice. All investments carry risk.